11 Tips on Finding The Right Infographic Ideas

You want an infographic but it seems like you have no clue what to make one about.
You probably have an idea or two, but you’re not quite sure if they’ll spark your audience’s interest.
With so much information for you to discover and topics to come up with— ideation, the first step of creating infographics is often the most difficult.
Nowadays, new content is constantly being published every minute, making it much more difficult to stand out, which is why having a memorable topic is so important.
Information accompanied by graphics is more likely to leave a memorable impression because it’s easier to remember an image than paragraphs of text.
This is because visual content is processed 60,000 times faster than text. It’s no wonder that 90% of information we remember is based on visual stimuli.

Infographics deliver great content in a digestible format which makes them highly shareable. A combination of stunning visuals, data, copy and most importantly— the right topic can make or break an infographic.
Infographics are great investments in the long run for all kinds of websites—whether you’re a DIY blogger or an SEO expert, infographics add an extra oomph to your brand.

A study by Hubspot states…
Infographics are three times more likely to be shared than other types of content on social media which translates into more traffic and backlinks.
Many people rush the process of picking a topic. Hastily deciding on an “okay” topic, researching for data, designing the infographic then publishing it to an empty crowd.
You could have an aesthetically pleasing infographic but without a great topic, it’s bound to be ignored and skimmed over.
What do people want to read?
How can you create content people want to read?
Is it interesting or beneficial enough that people will want to read it?
Most importantly, does it help the reader?
These questions are bound to come up when you’re searching for the “perfect” topic. But don’t worry, we’ll save you the hassle with these simple yet effective tips to find the right topic:
These tips will guide you on:
Finding your target audience

Brainstorming and research techniques

Tools to find trending topics and how to use them

Filtering and catering your ideas to your audience

Coming up with ideas that best convey your message

The truth is, a one-size-fits-all approach is not going to work. One of the biggest mistakes to make is having no specific audience in mind and trying to appeal to everyone at the same time.
An extremely broad topic won’t be as effective as a specific one. For example, an infographic about general history in English Literature won’t appeal to people who are interested in Shakespeare. By narrowing your focus, you’ll be able to create effective strategies for your specified target market.
You must have heard of traditional demographics segmentation used in marketing—in the broadest sense, it’s age, gender, religion, ethnicity, and education level. The attribution of these demographics provides information but it’s just not enough.
Income
Marital Status
Special Achievements
Job
Expectation and Motivation
Level of Understanding about your products
Concerns and pain points
Does it seem like you’re getting to know your audience on a personal level? Well, that’s the point. With so much information on your audience, you can create personas.
Personas are imaginary representations of your ideal customers based on research and data about your existing customers. They give you a better understanding of who you want to target and how to distribute your products/services.

A pizzeria is looking to create an online presence with an infographic. They identified their target market as men and women aged 20-25, interested in a healthy lifestyle. Their target market loves pizza but is looking to stay in shape. An infographic on a workout after a hefty pizza dinner and tips on choosing nutritious toppings ticks all the boxes.
Personas also help you allocate your efforts in the right place. By knowing your customers’ behavior, you won’t be setting out on a wild goose chase. If a person hasn’t opened their email in a year, it’s probably wise to not promote your products through email campaigns.
You already know the demographics segmentation and the personas for your target audience. Let’s dive deeper and focus on how your infographic can address your target customers' concerns. Here are 3 questions to ask yourself when searching for the perfect infographic topic:

It’s imperative to address to the whole of your audience, regardless of their buying potential. You have limited time and resources, but potential repeat customers are worth the extra effort because they can benefit your brand.
One of the greatest assets a business has is its customer base. Repeat customers spend 300% more money (according to RjMetrics). They are also great ambassadors for your brand, and the best part is they won’t cost you a penny.
Focusing on repeat business will create a loyal group of customers who will happily promote your brand. Repeat customers refer your brand 50% more than first time buyers.
Market research and customer insight are meant to reach one goal, and that goal is to get to know the customers on a deeper level and understand their needs. Understanding your customers is one of the many accomplishments to achieve.
Where can you find loyal customers? Well, you won’t have to search far and wide because they might be the ones you’re communicating with right now. People asking about your business, your rates or simply subscribing to your newsletter can be your next customer.
Most customer retention programs include rewarding customers, giving special perks or access and providing excellent customer service.

Maintaining loyal customers isn’t as difficult as it sounds. All it takes is some open lines of communication. Being accessible to your customers can do a lot for your business.
Communicating with your customers gives you the information you need about your customers such as their needs or wants. Most companies do surveys to get to know their customers or even follow up past the purchase phase by asking for reviews.

Customer retention is worth investing in because it’s simply easier and more reasonable to maintain the customers you have than putting extra effort into getting new customers. Loyal customers are also more profitable. According to research, engaged consumers purchase 90% more frequently and spend 60% more per transaction.
Besides, loyal customers are more receptive to outreach attempts and the most likely to engage. In fact, they are four times more likely to be welcoming when a brand reaches out to them.
Getting to know your current customers is the first step. Who are the people using your products and what do they wish to achieve by using them? You’ve established your target audience with personas. Now, it’s time to pinpoint their day-to-day concerns.
Knowing your target audience’s main concerns can help you find a great topic for your infographic. Start with identifying their gaps and pain points but don’t limit the information to just the problems you can help them solve.

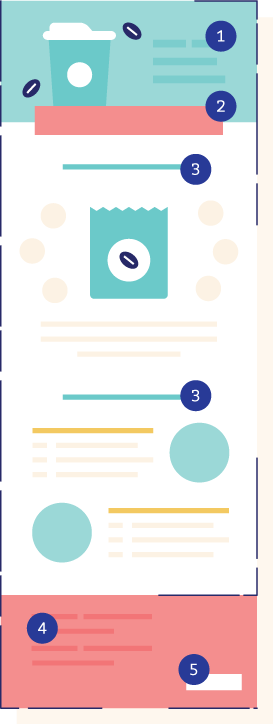
A coffee shop targeting young adults may discover that middle-aged people who work in the morning buy their coffee on a daily basis because they open earlier than other shops. Using this knowledge can help the coffee shop create a new menu infographic of delicious food and beverage combinations on the go to help save time for their consumers.
So, focus on how your content can help your customers. By addressing a challenge, a pain point or a topic of interest, you are telling your audience that you care about their needs.
Showing a sense of understanding and willingness to help your consumers can go a long way in building long-term relationships with your target market. Most importantly, communicating about their needs builds trust with your audience and trust is essential in converting visitors into clients.

The most important question of all is:
How can you help your consumers?
May it be answering your customer’s questions, helping them find a product for their need, or providing valuable information about how your brand can help them with their day-to-day lives. Once you are able to help them in any way, consumers are more likely to share your content with other people, bookmark your site or even better—promote your business and connect with you.
What problems can your brand solve? Having a thorough understanding of why your brand exists and what it offers to people can be a great guide for producing quality content your audience wants to read.
It’s important to create quality content that your audience will find valuable. It can range from a simple blog post, sharing content or even a monthly newsletter to keep in touch with them.
Don’t create content just for the sake of clicks or shares. Go beyond and create something your audience will truly find useful. Don’t strive for the most page views, but strive to be a trusted resource for your potential customers.
Find a way to showcase your strengths to show what customers gain from choosing your brand instead of other competitors. However, avoid talking too much about yourself and focus on the important aspect (your customers).
How do you learn about your customers? Here are two ways to do it:

Get in touch with your consumers. Strike up a conversation or simply email them— a survey could work as well. Good marketing strategies include focus groups, the use of business software to track customer behaviors or accessible customer research.
Find what your customers love about your product and what they don’t. Find out how your customers use your products or services because knowledge about their habits is valuable information for market research.

A range of customer services that focuses on assisting customers on how to use the product, troubleshoot or product maintenance. Wistia, a video hosting and analytics platform helped customers by demonstrating how to use different aspects of the software by using visuals.
Have you asked your customers what they like or do not like about your products or services? Observe what issues or difficulties your customers have with your product or service. Infographics can also be a medium to share things your customers don’t know about your product/service (an introduction to a new complementary product or a new function)
If you don’t know where you’re going, then how are you going to get there? The importance of setting business objectives can’t be stressed enough.
Other than being a means of measurement for achievement, setting goals carries a lot of concrete benefits.
Provides direction
Focuses on what is important
Clear decision making
Control of the future
Provides motivation
Take time to identify the goals you are looking to achieve with your infographic. Traffic increase is a common goal. However, it shouldn’t be your sole focus as it only covers the surface and its benefits are temporary.
Think beyond:
What do you want people to do after reading your infographic?
Here are some examples of business goals to examine when coming up with an infographic topic:
Having great brand awareness can amplify your business. But what is brand awareness? Simply put, brand awareness is how familiar consumers are with your products/services.
According to a study by Nielsen, 60% of global consumers with Internet access prefer to buy products from a familiar brand than switch to a new one.
Oxford defines brand awareness as:
The extent to which consumers are familiar with the distinctive qualities or image of a particular brand of goods or services.

When a consumer is familiar with your brand, they are more likely to choose you out of other brands with similar price points.
In a way, brand awareness leads to the possibility of repeat customers which results in customer loyalty. Maintain a valuable relationship with your customers, stay on their radar by keeping in touch with them regularly, whether through newsletters, promotions or surveys.
Include a brand statement to show potential consumers you have what it takes to solve their problem and provide ideal solutions.

Now, you’re probably thinking, how can I incorporate this in coming up with ideas for my infographic?
There’s so much you can do to increase brand awareness starting with creating high-quality content that showcases your company’s expertise.
Brands are constantly coming up with ways to retain their customers because attracting new customers is much costlier and more time-consuming. Brand loyalty is when consumers prefer a certain brand over others and is a result of continued satisfaction with a product. Strong brand loyalty is often subjective.
Brand loyalty is defined by Oxford as:
The tendency of some consumers to continue buying the same brand of goods rather than competing brands.

Having a strong customer base is beneficial. Price or affordability is always an important factor in purchasing decisions. Most of the time, consumers will observe and assess the products to see if it’s worth buying or not. Strong brand loyalty decreases price sensitivity which means customers would still make the purchase despite being more expensive.
Brand loyalty creates brand advocates, huge fans of your brand, who would willingly promote (advertise) it even without compensation. They can play a big role in your business as they create direct referrals, attracting new customers.

Some brands have various products to choose from. Deciding which product is right for customers can be time-consuming, especially if information about the products is limited. By providing customer education such as tutorials or descriptions about product uses and benefits, you’ll be providing information for customers so they can make the right choice.
Take the opportunity to address problems about your product or troubleshoot your products/services. Product update announcements or up-to-date information on your products can do a lot. Not to mention, it’ll help your customer service as well.

Provide content that’s valuable outside of the product offering. Showcase your areas of expertise by giving your customers (existing or potential) a preview of what benefits your brand has. The main goal is to create content that will benefit your customer with information.
Your infographic should benefit the reader and provide them with informational value. Now, how do you do that?

The first step is to gather as much information as you can. Keep in mind to do your research thoroughly. The point is to provide informational value but it’s necessary to make sure that your information is valid and will benefit your audience.
This can be done by looking at both internal and external sources and ask yourself how this information can enrich your audience.
When we refer to external sources, we are referring to what other people are saying and what their demands are. Some examples are forums, customer service questions, customer reviews or even unanswered questions.

Gain some perspective by looking into customer reviews about your service or product. Another way is to simply ask your customers what they want to see from you as a brand.
By looking into these external factors, you’ll be able to gain insight about what your target audience is into and what they find valuable.
Internal sources come from within the company and can come from your vision and mission and what you want to achieve with your content.

Internal factors can range from showcasing your company values to providing solutions for your potential consumers. It also depends on which target market you’re aiming for.
This can be done by publishing content that introduces your product/service or showcases how your brand can provide a solution through case studies, industry examples, book reviews or ebooks.
Positive reviews from customers can help your business a lot. Not only are they free promotion, reviews are much more trustworthy than advertising. People are more likely to spend 31% more money on a business with excellent reviews and that positive reviews make people trust a local business more.
What happens when you get a negative review?

When dealing with a negative review, remember to respond promptly and be real with your customers. Balance correcting inaccuracies with admitting your mistakes and don’t forget to write like a person, not a corporation.
Negative reviews actually help. Unfavorable feedback can be used as a guide to figure out what you’re lacking. It’s also a great way to know your customer base and what want to see from your brand.
Have you been asked the same questions over and over again? Or maybe you don’t have a FAQ? Then, your infographic topic can be based on answering your customer questions.

It’s a great way to show that you acknowledge your customer and that you have a genuine interest in connecting with them.
Make sure to provide an expert point of view. A customer would rather hear from a trusted consultant than an ordinary salesperson.
Another great way to find infographic content ideas is by asking engaging questions on social media.
Brainstorming is when the magic happens. Whip up that notebook and write down as many ideas as you can. It doesn’t matter how weird or silly, having all sorts of ideas is better than having none at all. This way, you can filter ideas worth keeping.
Brainstorming is about exploring all the options so it’s important to be open to all possibilities. Allowing yourself to wander and getting inspired is a great way to energize your mind before brainstorming.
Here are some tried and true brainstorming techniques:
A simple yet often overlooked word game, word association or word lists can be a powerful tool for brainstorming by uncovering new connections, insights and ideas.
Start with selecting a word related to your desired topic. Then, select another word that is related to the chosen word. The point of this exercise is to come up with as many words as you can so you have plenty of ideas to choose from.

A mind map is a diagram for visually organizing information. The diagram represents tasks, words, concepts or related words which are arranged around a central concept.
Mind maps are great for coming up with a bunch of ideas because the visual elements of mind mapping make it better for people to see connections between one word and another.
Where do you jot down your ideas? Do you write in your notebook or do you use an app on your device?
Here are a few favorite tools of ours for writing down ideas.

Evernote is available on most devices and is a great way to document and organize your ideas. Ideas popping up at the most random time or place? Just whip out your phone and add them to your Evernote.
Evernote's cloud-based system makes your notes accessible on any devices, perfect if you're constantly on the go and work on multiple devices.
You can also share your notes with others by sending them a link. Evernote also has an option for chatting for collaborating with other people. It’s great for organizing your ideas and notes.

Mindmeister is a web based mind mapping tool which allows you to mind map on the go. Since it is web based, you can create your maps on any device.
It’s great for visually outlining your ideas keeping your thought processes organized. Mindmeister makes displaying hierarchies and connections easier and makes note taking more efficient.
You can also share your mind maps with everyone (Just click on the Share Map button). It’s also easy to export the mind map to your desired format.
Although Mindmeister is free, you need to create an account (log in with Google for easier access).

Google Docs is a favorite of ours because it’s easy to use and it autosaves all our work on Google Drive’s cloud storage. Not to mention, the editing and suggesting feature allow easier collaboration which makes giving feedback a breeze.
Researching within the tool is also made easy with the “explore” option. Simply click on a word and click explore and a sidebar will appear with all the results.
Add-ons in the Google Docs tool make your ideation and creation process efficient. By partnering with several third-party software, access to add-ons such as Thesaurus, Easy Bib or Open Clipart (to name a few) can be installed with ease on the Add-ons option.

Keywords are the building blocks of your infographic and can help you narrow down your ideas.
Keyword research can make all the difference. Look into what people are searching, you can do this by doing some simple research online to see what has the most shares and what keywords tend to be used by taking a look at the search suggestions.
Aim for no more than a 4-word string for your keyword. Long keywords may be low in difficulty but due to its length and unique combination of words, they can be very low in volume.
However, too short a keyword is also to be avoided because 1-word phrases are often generic and broad which makes them much more competitive. It’s best to aim for 2-3 words when doing your keyword research.

Instead of using "pizza", which is a very generic, densely saturated keyword, use “healthy pizza toppings” instead, because it’s less competitive and you’ll reach your target market better.
So now that we’ve established that long tail keywords are better than short tail ones. How do you know which long tail keyword to use for your infographic topic?
We like to use this tool for our keyword research and analysis:
So now that we’ve established that long tail keywords are better than short tail ones. How do you know which long tail keyword to use for your infographic topic?

Ahrefs is mostly known as a powerful “backlink” checker tool. However, checking backlinks is just one of the many perks of Ahrefs. In a nutshell, Ahrefs is a toolset used for backlinks and SEO analysis.
Among their arsenal of neat tools are the site explorer, content explorer, Ahrefs keyword explorer, rank tracker, site audit and alerts which you can apply in your keyword research.
We’ll be focusing more on the Ahrefs keyword explorer. The Ahrefs site provides a large collection of guides for users to learn how to navigate the site and its tools. Since you’re already here, we’ll make it easier for you.
Here are the steps to how we utilized it for keyword research!
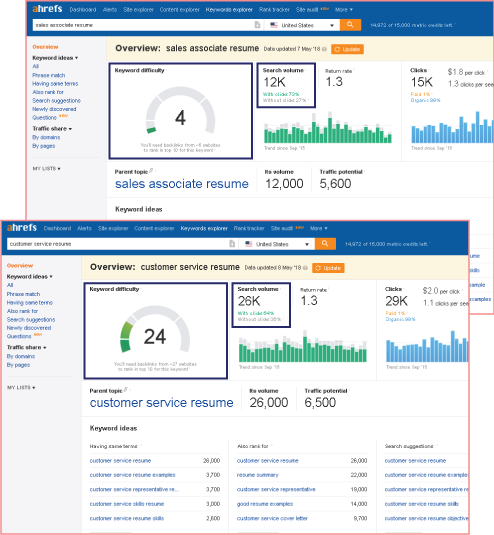
Go to Keywords Explorer and type in a keyword.
Click All on the Left hand corner.
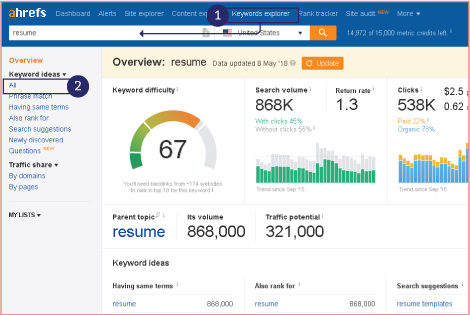
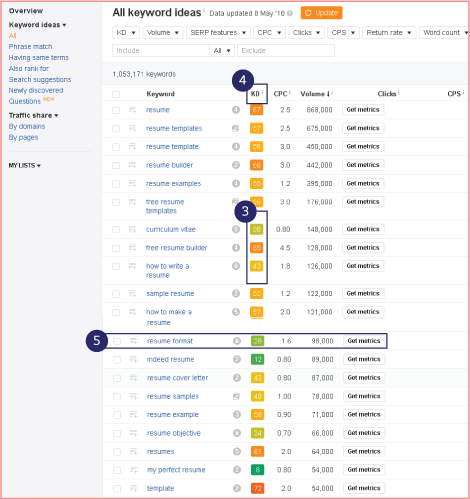
In the list of keywords, take note of the difficulty (highlighted in color) and volume.
To make viewing easier, click on KD (Difficulty) and it will rearrange it from the lowest to highest difficulty.
Here, we scrolled down and saw that there were a few words with low difficulty and high volume. These are the ones to include in your list of keywords. The keyword resume format has a pretty low difficulty and high volume, which makes it ideal to include in your list.
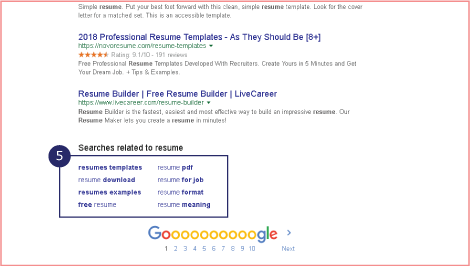
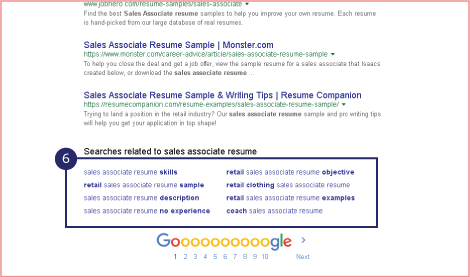
Google the basic keywords and scroll down to the bottom to see keyword suggestions from Google. This is also a good way to find more keyword ideas.
Choose a competitor site to input into the Ahrefs Site Explorer.
Click on organic keywords at the left.
To view from the lowest to highest difficulty, click KD (Difficulty)
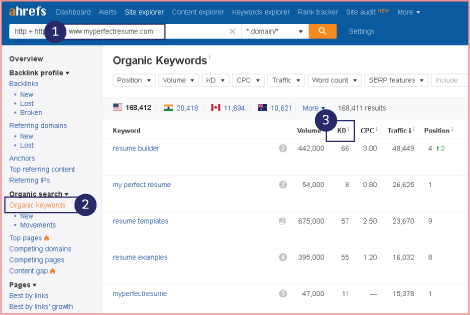
We chose 2 keyword ideas that were high in volume and low in difficulty.
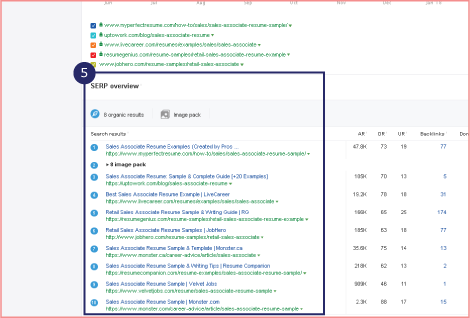
To get ideas on how you want your title to look like, scroll down to the bottom to see the SERP Overview which shows the front page search results of the keyword idea.
Google the keyword ideas and scroll down to the bottom to see keyword suggestions from Google to get different keywords.
Searching for inspiration can be a challenge if you don’t know where to look. With so many websites and information, it can get quite overwhelming.
Searching for references in Google is a great start but when you’re bombarded with so many results, it can be a bit confusing. Especially when infographics come in different formats, topics and sizes.
Search no more because we collected 4 of our favorite sites to look for inspiration. We believe these sites have a vast collection of great infographics out there that make excellent examples when searching for references.
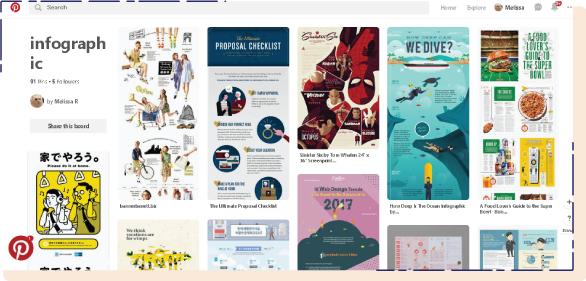
Pinterest lets you curate and find images by pinning images you liked or those you find interesting and lets you categorize them into boards.
The images can be linked to other websites as well. Other users can repin other users’ pins, sharing the website’s content and links effectively.
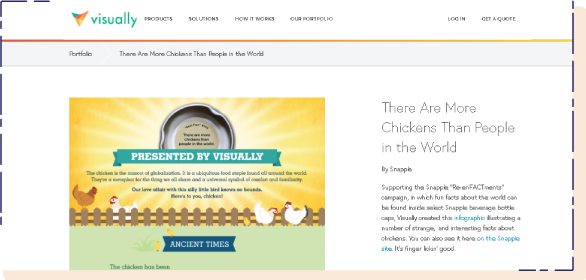
Visual.ly is a community for publishers, designers and researches that allows users to search images based on description, tags and sources in different categories.
This site is the largest online collection of infographics so you won’t be short of any inspiration here. A great addition to your inspiration board!
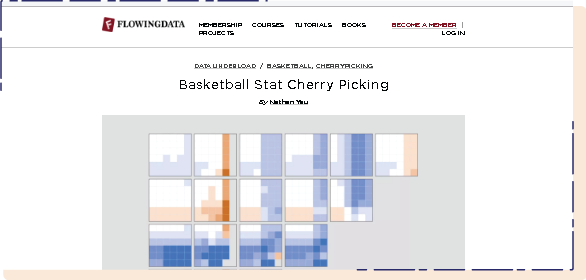
To find some examples of data visualisation, head on over to www.flowingdata.com. It’s not exactly infographic central but it’s inspiring to look at how data can be beautifully translated into images which could give you better ideas on how to turn your stats into compelling infographics.
www.ourworldindata.org shows data all around the world covering a wide range of topics such as health, food provision, growth and income distribution, violence, rights, wars, cultures, energy use, education and environmental changes.
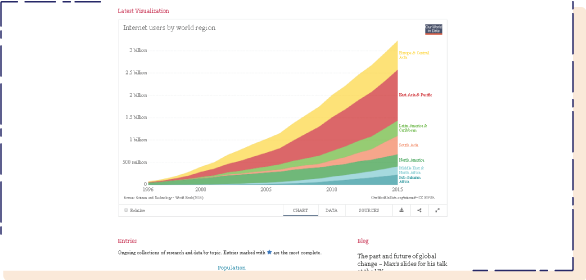
Ourworldindata allows visitors to use their data for their own content (with permission) and even provide a guide on how to embed their data for use.
Infographics vary in terms of types from the chronological timelines or simple lists— even animated! The type of infographic you want to use depends on what you are trying to convey to your audience.
The point of an infographic is to represent large amounts of information, complex data or a message for your audience in a clear, digestible way they can understand.
A simple how to guide or something as complex as ajax powered gravity forms can be made into a compelling infographic!
Choose an infographic format that best conveys your message. Here are some types of infographics and what they are best used for.
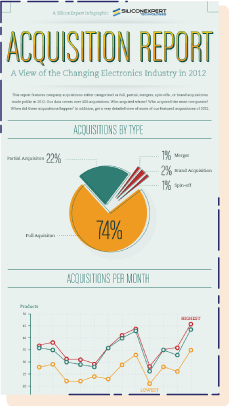
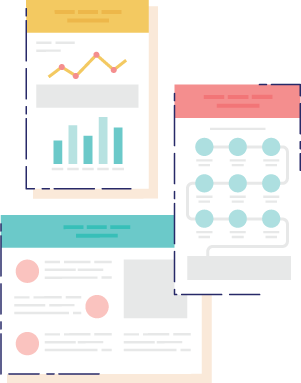
A Statistical infographic is best used to present data from multiple sources or backup an argument with relevant statistics. This type of infographic puts the spotlight on your data.
In a way, it’s telling a story using charts, icons, and images accompanied by text. Most infographics online use a combination of bold fonts and colorful icons to emphasize each statistic.
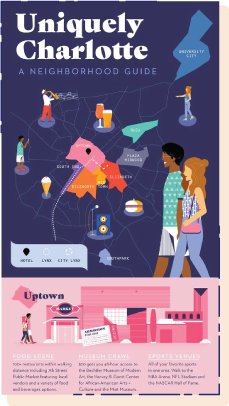
Map or location-based infographics are used to show area-based information. They can be used as the main focus of the infographic or as a way to support your message. This type of infographic is best used for showing trends in different regions. This guide on the Charlotte Neighborhood by Lemonly is a perfect example of a map-based infographic.
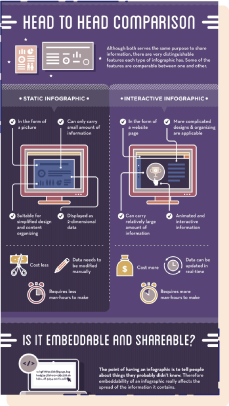
This type of infographic shows how much two (or more) objects have in common, their differences, or their benefits. This type of infographic is best used to review or compare products, services, or methods. For example, a comparison of a static and interactive infographic.
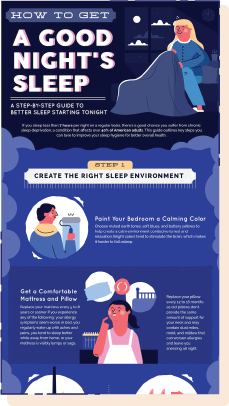
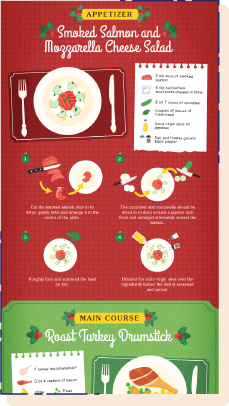
How to guides are similar to process infographics but they are more detailed and direct in explaining the steps and often times have extra tips or valuable information. They are basically a step-by-step guide to show its users how to create or achieve something. This type of infographic is best used for visualizing complex instructions. For example, a step-by-step infographic on how to get a good night’s sleep.
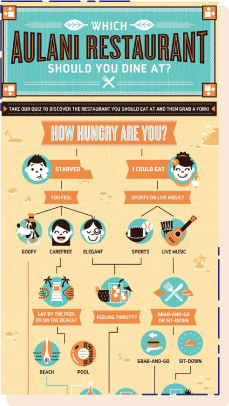
A flowchart infographic or a process infographic is a diagram that illustrates a process or workflow. It is used to show a process flow or steps to certain outcomes/conclusions. Another use for flowchart infographics is to illustrate how a topic diverges. This type of infographic is best for creating quizzes or forms to help users make the right decision. A great example is this infographic quiz to decide on which Aulani restaurant to eat in.
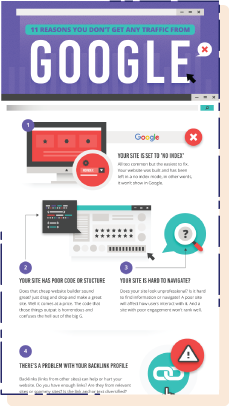
A classic list infographic (AKA. the List-o-graphic) shares a lot of information in the form of text and icons. Most list infographics are straight to the point and loaded with valuable information. They are also versatile and easy to skim and viewable content while able to maintain the overall message. For example, 11 Reasons You Don’t Get Any Traffic from Google.
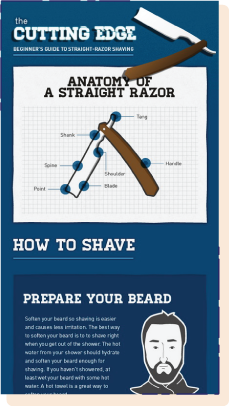
An anatomy infographic breaks down an object’s composition to show what it’s made of or how it works. This type of infographic is best used for describing different parts of an object.
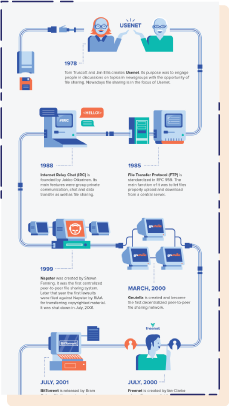
A timeline infographic displays the evolution of a topic or to tell a story in chronological order. This type of infographic is best used for telling brand stories or how something has changed over time. For example, Automation Over Time.
A Process infographic shows a series of numbered points in a linear fashion. Process infographics break down processes into steps that are easy to follow. A timeline infographic highlights points in time but a process infographic provides a summary or an overview of steps in a process.

When you’re stuck in a rut and don’t know what to make an infographic about, look at what’s trending.
After searching the web and browsing through many different sites, we finally gathered some of our favorite sites we think compiles current affairs the best way possible.
These are a list of sites we’ve used to find trends and topics for infographics.
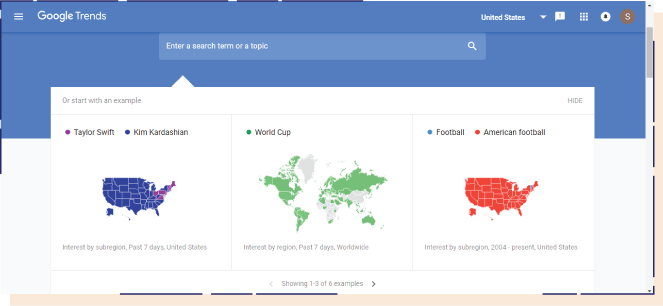
Google Trends is great for reading the most trending news and most searched articles. Surprisingly, Google Trends can be used as a keyword research tool.
However, don’t confuse Trends with Ahrefs because they have different purposes. Google Trends is used to identify seasonal trends so you can create content at the ideal time.
Google Trends provides abundant data that can help you create an effective content calendar to help you reach your target audience effectively.
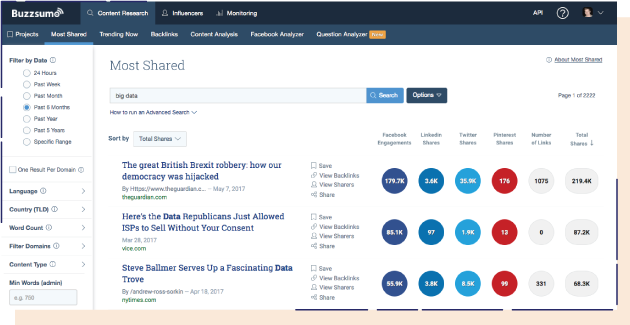
Buzzsumo allows users to look at what articles have been shared the most by topic or website.
Knowing what people want to read is useful. When you’re creating infographics, you want to see what people love to share on certain subjects. Buzzsumo helps you find what’s current and shared by many and gives a good idea of what might or might not work as an infographic.
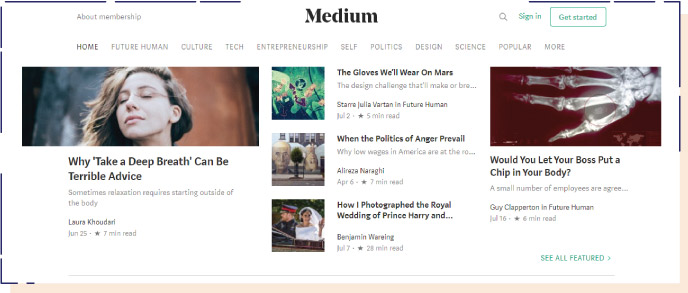
Medium has a lot of great articles for copywriting inspiration. They also cover a lot of topics from writing to content marketing and lifestyle as well.
Medium has exclusive content for users who pay for premium access, but there is a lot of free content worth reading.
Google Scholar or Semanticscholar.org are academic search engines that use an algorithm to provide relevant results. These search engines are great sources for journals or scientific researches provide reliable information because their search results come from valid studies.
Flipboard, Google News, Alltop and Reddit are some examples of new aggregator sites to check out when looking for buzzworthy topics.

Stay up to date and get the latest news from these news aggregators.
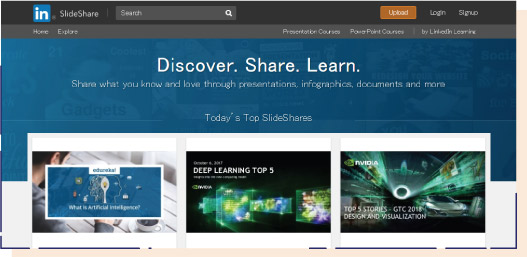
Slideshare carries a lot of interesting topics in presentation format. It’s a crowdsourced site with plenty of presentations on various topics.
Data visualisation inspiration can be found here. Fivethirtyeight presents news in a unique way with statistics and charts.
Repurposing content is reusing your existing content in different formats. You can repurpose a blog post into an infographic or post it on other platforms. This allows you to spend your resources on other areas and lets you squeeze more value from the content you already have.
When it comes to creating infographics, you have a little bit of freedom to choose your content.
Some of the benefits of repurposing:

By repurposing, you are able to reach out to different audiences. For example, repurposing your blog post into a video will reach a new audience on a different platform. Or maybe you want to turn a video you made into an infographic. Either way, you are expanding to different platforms and exposing your work to different people.

Repurposing also saves you time and effort by eliminating the ideation time. You already have the materials, it’s time to find what angle you want to present it in and which audience you want to reach.

In the end, repurposing content into infographics helps you gain more backlinks and shares. If your blog post doesn’t receive the backlinks and shares you think it deserves, repurposing can help you prolong the life of the content and get more out of it.

In essence, any content can be repurposed into an infographic. See a blog post you like? Turn it into an infographic. Or that inspiring podcast you listened to on your morning commute. A YouTube video you gave a thumbs up to or the list of actors nominated for the Academy Awards could be translated into an infographic. The possibilities are endless. The best part is that you can repurpose content from other blogs or sources.
Here is a list of content you can repurpose into an infographic:
Blog posts
Sales pages
Podcasts
Videos
Any written content
Prior to repurposing, make sure to ask for permission from the creator if it’s okay to use their content. Some creators might be happy to share their content but it’s important to be respectful and ask before repurposing their work.
When you have permission to repurpose their content into an infographic, don’t forget to give credit where it’s due.
Make your infographic content stand out with the Skyscraper Technique by Backlinko’s Brian Dean—defined as a system for turning content into high quality backlinks, by improving existing content by adding more value with updated or better information.

In order for this technique to work, first, you need to start researching popular trends, topics or pieces of existing content that are already doing well. Turning to examples saves you more time, especially if you have a tight time-frame to stick to.
The next step is to look for new ways to create content that conveys a similar message in a different way. This can be done by leveraging the details by adding new components such as updated statistics or a better design. The Skyscraper Technique adds more value and improves the original content.
Here is a simple step by step approach on how to repurpose your written content for an infographic.

For instance, you want to repurpose your blog post that got lots of shares. If your post has 10,000 words, repurposing the whole copy isn’t ideal because it would take up a lot of time and scrolling through a long infographic isn’t going to appeal to anyone. So, it’s important to trim the fat. Make sure to make your content as concise as you can.
Get rid of all the fluff and keep it to-the-point. Take note of the length of the content you’re trying to repurpose. If it’s too long with too many important points, consider finding another blog post to repurpose or hiring an editor.
An outline is a general layout of your content. It’s a system used to organize your points.
Every outline must have :
The main infographic topic
To divide primary talking points or ideas
To divide sections and identify different topics within the infographic
Where sources or references used are placed
For the designer
If you have no experience in Adobe Illustrator or Photoshop, hiring a designer is a great idea. Share your outline with the designers to ensure your vision of the infographic is clear so it’s easier to come up with a design you approve of.
The outline should include a title of your infographic, clear sections with your points. Your audience can’t read your mind. Your outline should be able to clearly convey your message to your audience.
Charts and statistics can make or break your infographic. You might have a bunch of awesome data that could translate into a lot of attractive charts (bar charts, pie graphs) but do they add value to your content?
Keep a balanced amount of statistics. Make sure your charts and tables are easy to understand and don’t overwhelm the reader. A complex graph should have some text to help explain to your audience.
Although data is good for infographics, avoid going overboard. Brian Dean from Backlinko mentions that infographics should contain no more than 7-10 data points to avoid confusing your audience.
Depending on what your main goal is, decide on the length of your infographic. Do you want it to be long-form or short-form?

Long form blog posts do well SEO wise. Many long infographics have become popular due to its amount of information but it’s still important to be concise and make sure you’re conveying the necessary information.
Since long form content has grown popular, a lot of people think resorting to super long content is going to get them great traffic. People mistake length for quality, but that’s not the case.
Big or long infographics are great for showcasing statistics and data and according to flowingdata.com, they get more views, but remember to keep an eye on the length (limit to 8,000 pixels).
Long form content works for ultimate resources. Wikipedia and IMDB are prime examples of ultimate resources. Unless you’re making a guide or long content that people will bookmark, it’s wise to stick to something shorter.
Shorter content has a bigger chance to get read and a lot of popular blogs will refuse content that is too long.
Short infographics are bite-sized and easy to share. If you want to share your infographics on social media, short and snackable content is the way to go.
We always suggest ending an infographic with a call to action. Applying these components will make a compelling outline for your infographic.
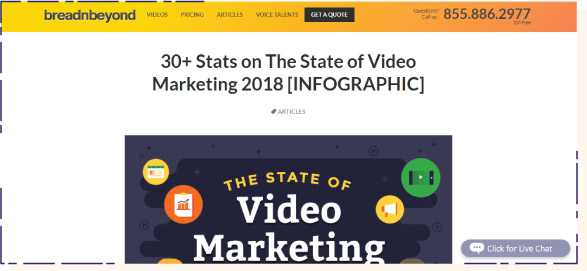
Breadnbeyond’s infographic is a great example of repurposed content. Their post titled: 30+ Stats on The State of Video Marketing 2018 [Infographic] comprises of statistics from 30 different sources explaining the highlights of video marketing in social media platforms.
Most of the content they used came from a variety of blog posts, articles and statistics from different sites such as Forbes, Youtube and Facebook Newsroom (to name a few).

Having a feasible topic can save you lots of time and make the whole infographic creation process much easier. Avoid topics that are too niche or has little information to support your research process so you don’t end up with an unfinished infographic.

Available information that comes from credible sources eases the research process. When you have little to no information, your infographic might end up being incomplete. After writing your draft, don’t forget to cite the authors from your sources.

Infographics are meant to inform your audience and provide them with valuable knowledge. An abstract/opinion-based topic has little credibility and would be better as a rant on a personal blog.

Advertising is beneficial for any brand, but consider where you’re placing your advertisement. No one wants to constantly see ads about your product or service plastered all over an infographic. People look for valuable information in an infographic.

Similar to catering to a broad audience, having a topic that’s too broad is ineffective. These topics will end up unfocused and possibly bore the readers. Narrowing down your topic will make your content more engaging and memorable.

You simply don’t have any resources to backup your topic. This is fatal since infographics are data driven. An infographic without any sources is no more than an opinion and opinions lack credibility and facts.
We’re not quite done, yet!
You’ve read our technical tips in coming up with infographic ideas, but what about the psychological side of crafting one? Specifically, writing a good copy because a good copy is the key to a successful infographic.
We’ve all had one of those moments where we couldn’t come up with anything, aimlessly staring at the blinking cursor on the screen, leading to a brick wall and really bad writer’s block.
If making an infographic was like making a cake, writing would be making the batter. So, without the batter to bake an actual cake, what would we have left?
Probably some delicious frosting, but nothing delicious to bite into!

We know. You worked really hard and spent a lot of time coming up with that idea but it’s important to not get attached to it. Being emotionally attached to one idea is an obstacle for growth. Ideas are only valuable when they are applicable.
One reason we get attached to ideas is simply because we created those ideas. Also known as the IKEA effect—we love whatever we build and we have to throw away something we ‘built’, it’s not an easy thing to do. To add to the IKEA effect, the effort we put in an idea increases affection and attachment to it.

Letting go sheds a lot of burden on your shoulders. When you have zero attachment from your ideas, you have a lot of room for growth and exploration which could lead you to better ideas.
Don’t be afraid of letting go or getting criticism. With more room to grow and explore, you are opening yourself to future achievements.
It’s not going to be easy. In fact, you’ll probably get frustrated because digging for ideas for your infographic is like looking for a needle in a haystack— not instantaneous (fellow writers might know). Awesome ideas don’t just come by day in, day out. It takes time and effort. So if you don’t get it right the first time, don’t beat yourself up.

The art of writing takes time to master. It’s not impossible but getting it right the first time is highly unlikely and that’s totally okay. In our experience, infographic creation takes more than one try and isn’t created overnight. So, make the most of it and don’t focus too much on trying to get it right the first time, because that’s not going to happen.
The point of the first draft is to get all your ideas out without any restriction. When you concentrate on trying to achieve the perfect word count, sequence, and style, you will get sidetracked from getting the good stuff out (your ideas).
Take a deep breath, make mistakes and let it go. The idea block won’t go away instantly but it’ll get better.

You’re hoping you could act fast and come up with ideas quickly but sometimes you’re going to get stuck and it’s going to seem like nothing will inspire you to write anything. The first thing to do when you get in this situation is to keep writing.
It doesn’t even have to be related but just write anything. It might be something short of a poem or even a long page of ramblings.

Hearing criticism isn’t an easy feat. Nobody likes to be told they’re wrong and as we discussed before, having someone criticize your work feels like they’re criticizing your baby. To be open to criticism means to let go of any attachment of your ideas.
Once you see past the harsh words, you’ll see that criticism is beneficial because you’re getting advice on how you can improve yourself.

After your completing your first draft, do a substantive edit. A substantive edit is when you edit your structure and flow. Perhaps you’ll spot a few points that would fit better in another section. A substantive edit gives you a chance to fix structure and rearrange your draft.
Grammar and style come second. Structure and flow come first because it’s more intricate. Grammar is much easier to fix and won’t take a lot of time.
Consider using grammar editing tools to proofread your copy. Google Docs has a spell checking tool but we also like to use Grammarly to check the structure and basic grammar to ensure our infographic copies are mistake-free.
However, since Grammarly doesn’t support Google Docs, you have to download an extension for your browser.
A final proofread is a must for any type of writing. You’ll never know what you’ll find and maybe there were a few parts you didn’t notice prior to the final proofread. So, actively editing your draft is a great idea to prevent fatal mistakes in your copy.
You don’t have to have a background in English Literature or a published best seller. Writing can always be improved over time as long as you have the will to do it.
That’s the gist of being patient with your drafting, now here are some tips you could start doing this very moment:

Pick up a book or read some articles online. Get more references and exposure to different writing styles to get some inspiration for writing.

Preserve those random ideas by jotting them down on your phone or a notepad.

Criticism is your friend and getting feedback is one of the keys for improvement. Show a friend your copy and ask what they think about it.

Like having a bunch of tabs open on your browser, your daily mental load can get in the way of the creative space. Give your brain a break. Declutter your mind with nature. According to a study, interacting with nature increases mood and creativity.

In between your writing. Sometimes powering through writing a piece can affect the quality of it and taking a break can actually keep your mind sharp and help you resume working with a clear mind.

The biggest mistake of writing is to expect perfection the first time. Remember that no successful writer gets it right the first time and everyone needs revision and editing—even Hemingway!
http://www.2girlsconsulting.com/blog/BOSVIEW/3-Infographic-Topics-that-You-Should-Avoid-/