Content marketing is the key of a successful marketing. There are more than 1.6 millions blog posts published every single day, your old ‘post and pray’ is no longer a viable way to drive in traffic to your website. In this guide, we outline how to make the most of your content using a neat and powerful tool: infographics.
In this guide…
Where and When You Need an Infographic
Best Way to Convey Message in Infographics
How To Get Tons of Backlinks from Infographics
Static vs Interactive Infographic
Your First Infographic Was a Success, What’s Next?
01
Where and When You Need an Infographic
Embed The Full Infographic On Your Site (copy code below):
<a href="https://milkwhale.com/viral-infographics-guide/" target="_blank"><img src="https://milkwhale.com/wp-content/themes/milkwhale2/landing/viral-infographics/img/infog/full/infog1.jpg" border="0" width="800" height="6070" /></a><br /><span style="font-size: 12px;">Click image to open interactive version (via <a href="https://milkwhale.com/viral-infographics-guide/">The Ultimate Guide to Viral Infographic</a>).</span>
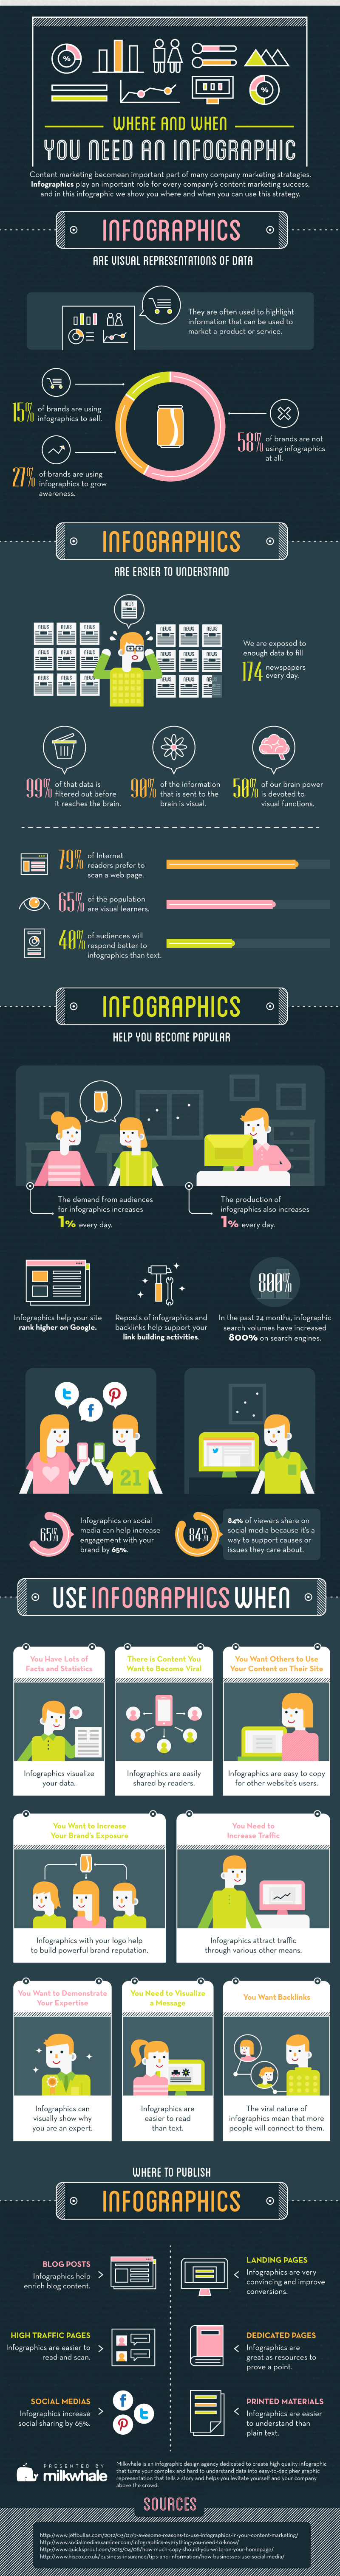
Infographics play a definitive role to direct traffic to your website. All you need to do is a good understanding on what occasion we need infographic and the right place to publish it.
Once we can ace those two, it’s only a matter of time for you to get that unlimited traffic Google can bring you.
Infographics are visual representation of information and data. It often highlights information that can be used to market a product or service.
In contrast to texts and audio, visual data is much easier to be stored in our brain.
And when visitors are only scanning, or skimming through your articles, it doesn’t matter how magnificent your content is because nobody will read it anyway.
Your contents deserve to be out there and read by the public, not left abandoned in the corner of your website in an unvisited page.
This is where infographics step in, and why it became the Internet’s user’s most loved format to present an array of data.
They are highly shareable to most places on the internet, namely social medias, blog posts, landing pages, emails, and even printed materials.
Not only that, bloggers can also embed infographics on their website. This means more backlinks, and backlinks are always welcome.
Infographics are still holding the top rank of the internet content, therefore those who already reaped success with infographic keep producing them periodically.
The demand of infographics increases 1% each day, and so does their numbers on the internet.
Creating infographics can cause a chain reaction called link-building.
First, the infographic is published as a content to a website, or as a social media update.
Second, if the target readers find it interesting, they will share it on their Facebook, Twitter, and other social media.
Having a large publication or a famous blogger in the same industry sharing the infographic will be a big help to get a big traffic increase.
Ultimately, the infographic by itself helps your website rank higher on Google.
Although the exact algorithm is kept in the dark, Google tracks how many visitors have been on a specific page.
In short, the more visits you get on your website, the higher the chance that Google considers your website valuable for certain keywords.
02
The Best Way to Convey Message in Infographics
Embed The Full Infographic On Your Site (copy code below):
<a href="https://milkwhale.com/viral-infographics-guide/" target="_blank"><img src="https://milkwhale.com/wp-content/themes/milkwhale2/landing/viral-infographics/img/infog/full/infog2.jpg" border="0" width="800" height="7242" /></a><br /><span style="font-size: 12px;">Click image to open interactive version (via <a href="https://milkwhale.com/viral-infographics-guide/">The Ultimate Guide to Viral Infographic</a>).</span>
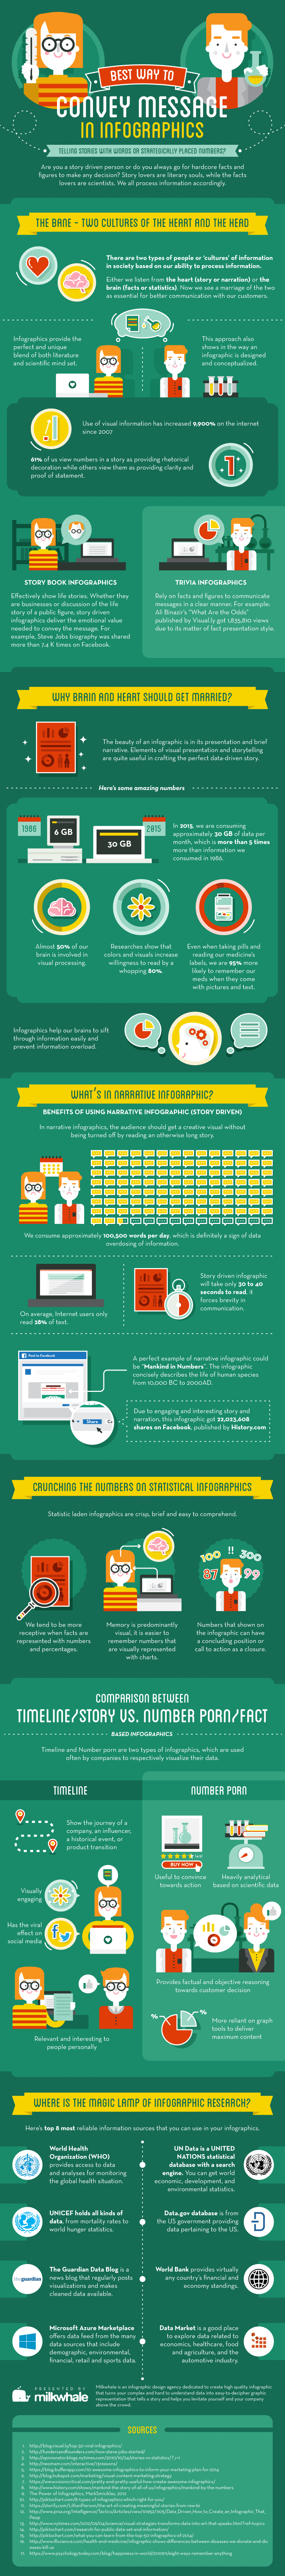
There are so many ways to convey information with infographics, but essentially, it is a combination of data and visuals supporting it.
Just like any other market, we need a buyer or a target market to sell our product first.
In infographics, we need to know who will read this infographic, and more importantly: “what will the readers get from it?”
There are different types of readers
For this purpose, we devide them into two different types, the Brain and the Heart.
The Brain
is the type of person who loves numbers, statistics, charts and such.
The Heart
on the other hand, loves narratives and stories.
There are also different kinds of infographics when viewed from the type of information contained, we call them narrative infographics and statistics infographics.
Narrative infographics are visual storybooks. This type of infographics delivers emotional value needed to convey the message.
However, narrative infographics are in fact NOT just stories. It’s more a story-driven collection of data.
It takes a string of data, for example human population from 2000 to 2015 to put narrative infographics into your pot of viable choices.
Narrative infographic is perfect when combined with a timeline.
Besides, a narrative infographic has a huge chance to go viral. You can always count on neat visuals and compelling story to attract views and get the viewers talking and sharing.
Statistical infographics rely on facts and figures to communicate messages in a clear, concise manner.
It’s basically a string of relevant statistics and facts presented together to convey a message or prove an argument.
Human mind tends to be more receptive when facts are presented with numbers and percentages. However, not everyone is best friends with math and statistics. Since human memory is predominantly visual, numbers that are visually presented with charts are easier to remember.
The strong feature of a statistical infographic is it presents a rational/objective point of view. It also appeals to a more seasoned audience who prefers a thorough, analytical approach to the subject matter.
So, which one is better?
It depends! Most of the time, combining these two produces a better representation.
You should consider the subject matter and the type of audience your content is aimed at.
Another thing you should keep in mind is the main purpose of the infographics—help the readers sift through information easily and prevent information overload.
Refrain from cramming too much information in one infographic, stick to the main idea/message, your readers will thank you for it.
03
How To Get Tons of Backlinks from Infographics
Embed The Full Infographic On Your Site (copy code below):
<a href="https://milkwhale.com/viral-infographics-guide/" target="_blank"><img src="https://milkwhale.com/wp-content/themes/milkwhale2/landing/viral-infographics/img/infog/full/infog3.jpg" border="0" width="800" height="7601" /></a><br /><span style="font-size: 12px;">Click image to open interactive version (via <a href="https://milkwhale.com/viral-infographics-guide/">The Ultimate Guide to Viral Infographic</a>).</span>
The plants in your backyard might just survive with rain and groundwater, though they will be much better if you provide fresh water every now and then.
Backlinks for your website is just like fresh water for your plants.
Your website will be able to grow with organic traffic, but it will grow better, and likely to grow faster, with backlinks.
Backlinks and infographics
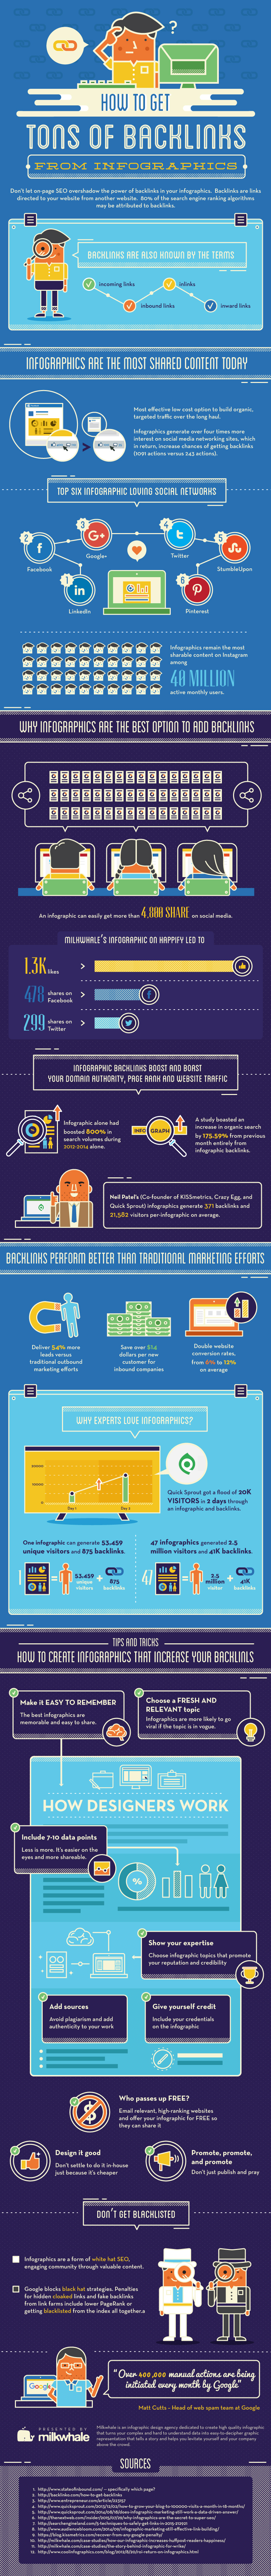
Backlinks, also known by incoming links, inbound links, inlinks and inward links are links directed to your website from another website.
A whopping 80% of search engine ranking algorithms may be attributed to backlinks, and thus, generating backlinks is one of the main purposes of infographics.
What makes infographics so effective in generating backlinks?
01
Infographics are the most shared content on the Internet.
Infographics generate four times more interest on social media networking sites, which in return increase chances of getting backlinks.
Facebook, Twitter, Google+, StumbleUpon, LinkedIn, and Pinterest are the particular hotspot for infographics. On Instagram, with its 40+ millions monthly active users, infographics rank among the most shareable contents.
02
Infographic backlinks boost your domain authority, page rank and website traffic.
Backlinks perform better than traditional marketing.
Backlinks have been proven to deliver 54% more leads compared to the traditional outbound marketing.
When a website embeds an infographic from your website, it is very likely that that particular website is in the same industry as yours. There’s a great chance their viewers are also in your targeted demographics.
QuickSprout, a business and marketing blog, generates on average 20,000 visitors within 2 days of publishing their infographics and backlinks.
Now that we’ve established the power of infographics for getting backlinks, it is important to note that NOT all infographics are made equal.
Some can net you a bajillion backlinks and get your site’s visitors buzzing and sharing to their social circles, while others just barely made a blip in the blogosphere.
The ones that succeed are generally made with precision and creativity. While the creativity part is highly dependent on the creatives producing the infographic, we can give you some insights about what you need to to improve the precision.
Make it easy to remember.
The point of making an infographic is not only to turn people’s heads, but also to make it stick with them.
Your content needs to be unique and memorable. Wrap an established idea in a new setting, throw a personal touch for a change, and avoid clichés and overused themes.
Choose a fresh and relevant topic.
If your website is all about bicycles, you might not want to have brain cancer as your infographic topic because they are completely IRRELEVANT to your brand.
However, you might want to create an infographic about lung cancer as bicycles do not cause air pollution, and promoting awareness about clean is something your audience can get behind.
Once you found a relevant topic, make sure it is fresh and if possible, is (or about to go) trending.
An infographic about how Windows XP 98 was developed will not generate much interest over the internet, but when Microsoft is about to launch their latest OS, an infographic showing the history of Windows will generate a good amount of interest.
Include enough data points.
Having an adequate amount of data points is important. Your infographics shouldn’t be too complex nor too simple.
Compile as many data as possible, but only choose a few (about 7-10) that you deem most important, and can be explained clearly and briefly.
Show your expertise.
Another reason why you should pick a topic that is relevant to your field is to show your expertise.
Even if you have a huge website in general insurance with 150,000 visitors per day, it won’t help you much when you write an infographic in the computer programming field.
Given your knowledge and experience, posting an infographic about ‘insurance scams’ or ‘what to look out for when shopping for insurance’ will be more useful to your visitors.
You can, however, extend your reach by getting an expert in other fields guest-posting on your website.
Include sources.
Remember to cite the sources where your data came from. Citing sources used in your infographic provides academic credentials, as well as provide neccessary attribution and credits to the original writer/publisher.
Remember to cite your sources
Keep your sources up-to-date and avoid referencing user-generated sources. This means Wikipedia, Yahoo Answers, or online forums are off limits. Track down the sources cited in such platforms (if any) and verify the data.
Credit yourself.
As you’re building links and brand, you need something to make your viewers realize it is your infographic.
It can be in form of watermark, a certain arrangement or illustration style of the infographic.
Anything that can refer your the readers back to you when they see your infographics on the internet.
04
Static vs Interactive Infographic
Embed The Full Infographic On Your Site (copy code below):
<a href="https://milkwhale.com/viral-infographics-guide/" target="_blank"><img src="https://milkwhale.com/wp-content/themes/milkwhale2/landing/viral-infographics/img/infog/full/infog4.jpg" border="0" width="800" height="7093" /></a><br /><span style="font-size: 12px;">Click image to open interactive version (via <a href="https://milkwhale.com/viral-infographics-guide/">The Ultimate Guide to Viral Infographic</a>).</span>
Earlier we’ve explained about different type of infographics based on the type of data.
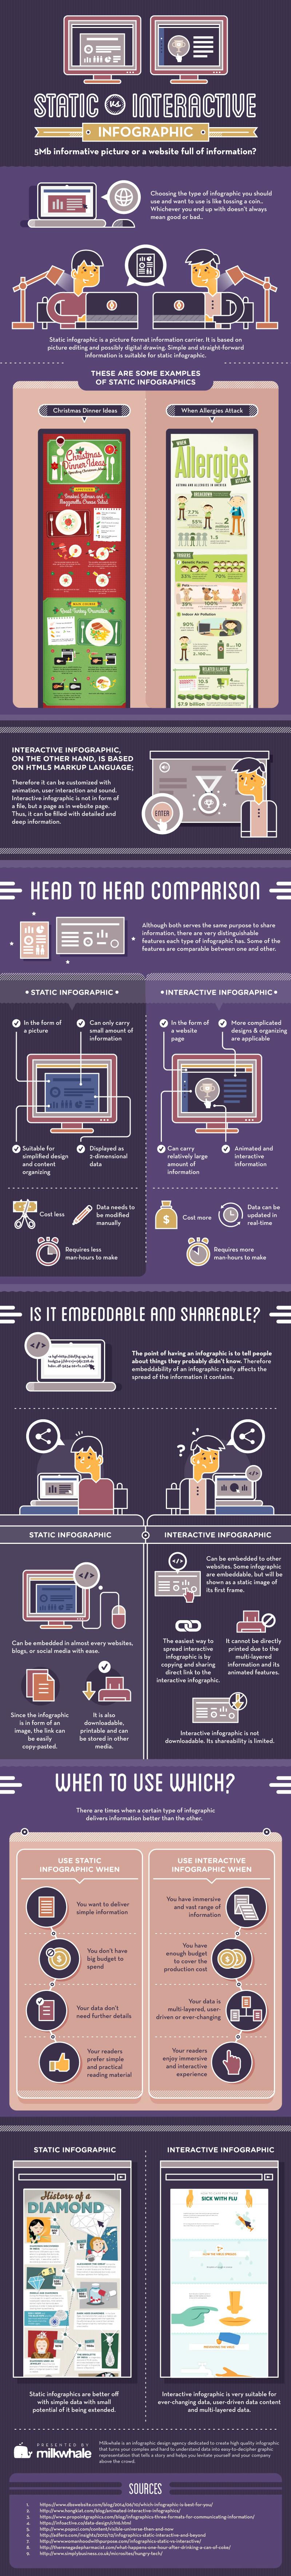
Now we’re going to explain about different kinds of infographics, based on the format of the infographics: static and interactive infographics.
Static Infographic
You are probably already familiar with this type of infographics as it is the most commonly distributed. Static infographics are image files (usually in .JPEG or .PNG format), and can be found on virtually any social media platforms.
Arguments for Using Static
01
Static infographics are highly shareable
As static infographics are just image files, they can be easily shared on the internet, like selfies in your phone. Upload them to your site/blog, or as a post on social media platforms you frequent.
02
lightweight and ideal for small-screen reading
More and more users switch to mobile as their primary digital platform. The relatively small size of the format is perfect for reading on mobile devices.
03
require smaller commitment (both time and budget)
Static infographics cost only a fraction of their interactive counterpart due to its less complicated structure.
You can even get one for free, if you have the skills. Online tools like Piktochart or Canva can get you started at little to no cost.
Interactive Infographic
Interactive infographics usually take form of a web page designed in a way that allows interaction between the viewer and the data presented.
This creates a more immersive, engaging experience, and enables presentation of complex data, which can be less feasible on static infographics.
Arguments for Using Interactive
01
interactive infographics can contain massive amount of data
Viewers can opt for which data to be shown at their convenience. This kind of interactivity allows a wide range of data to be presented without creating information overload.
02
present a visually engaging and Immersive experience
More and more users switch to mobile as their primary digital platform. The relatively small size of the format is perfect for reading on mobile devices.
03
offer a great deal of customizablity
As it is based on HTML5, interactive infographics practically can offer whatever a website can have: audio, video, mouse interaction such as clicking and scrolling.
You can even have multi-layered objects, creating an illusion of depth, and grab external data, allowing automated data updates.
05
Your First Infographic Was a Success, What’s Next?
Embed The Full Infographic On Your Site (copy code below):
<a href="https://milkwhale.com/viral-infographics-guide/" target="_blank"><img src="https://milkwhale.com/wp-content/themes/milkwhale2/landing/viral-infographics/img/infog/full/infog5.jpg" border="0" width="800" height="6720" /></a><br /><span style="font-size: 12px;">Click image to open interactive version (via <a href="https://milkwhale.com/viral-infographics-guide/">The Ultimate Guide to Viral Infographic</a>).</span>
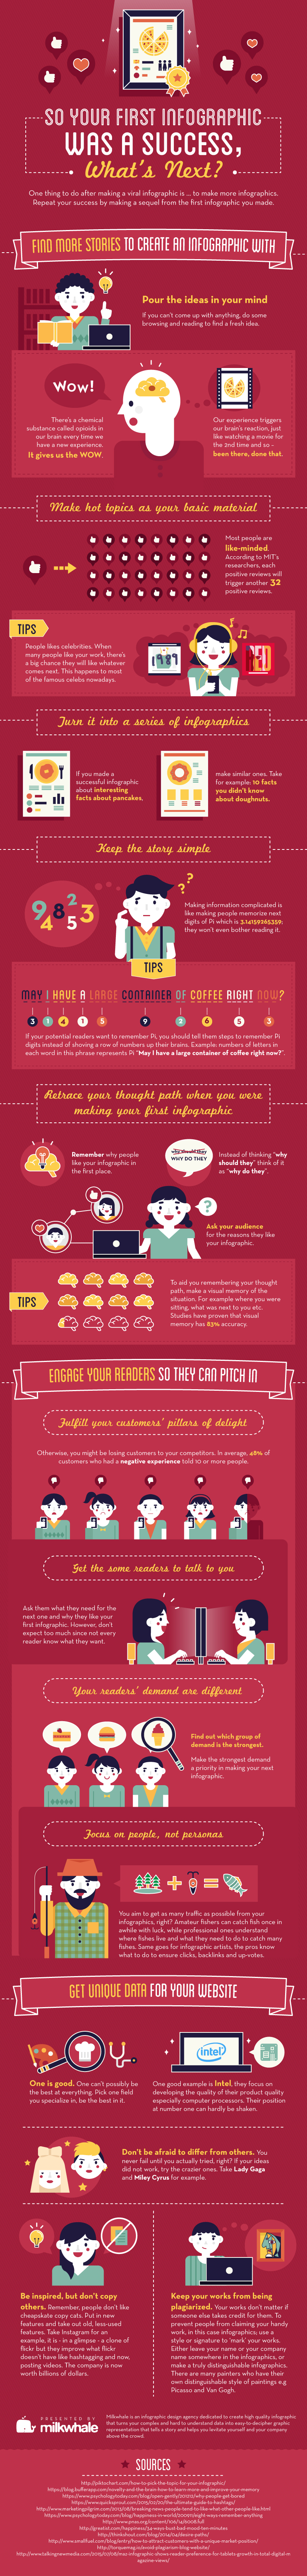
You’ve aced your first infographic? Congrats! Still, it’s not a reason to stop.
Your first success in driving backlinks with an infographic should not be your finish line. Those visitors will expire.
There’s more to infographic link building than just having 10,000 visitors today.
If your goal is to build a massively crowded website, it is only the initial step in a hundred miles journey.
No idea what to do next?
Find more stories to create infographics with
Why not continue your good run? Find other topics within the same category/theme as your first post.
Turning it into a series of infographics will benefit you by increasing awareness and recognition of your content.
engage your viewers by allowing open discussion
Listen to your viewers and get to know what their preferences are. Have an open communication channel and talk to them regularly, but also be aware of trolls and that it is impossible to please everyone, so learn how to handle them .
set yourself apart from the crowd
The obnoxiously overused ‘be youself’ rings true here. Are you a DIY home repair enthusiast? Focus your infographics on that topic. Don’t try to emulate others just for the sake of jumping the bandwagon.
This guide should give you a great deal of understanding on how to create a viral infographic, but if you want to learn more about infographics, do check out the links we compiled below: