A Beginner's Guide to Google Analytics

What is Google Analytics?

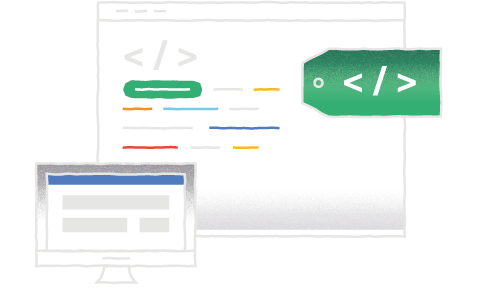
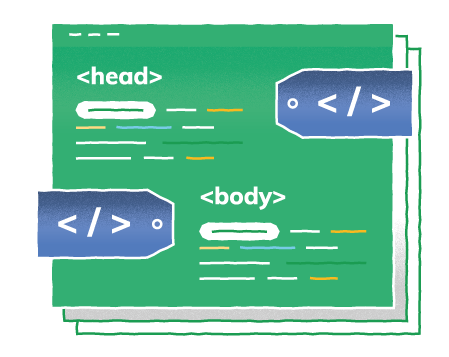
Launched in 2005, this service tracks and reports website performance using the GA tracking code.

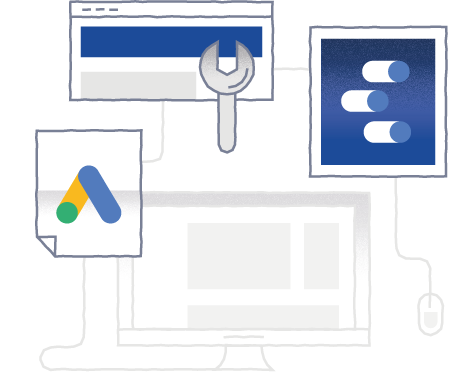
This program is integrated with other Google products like Adwords, Search Console, and Data Studio, which means you’ll get deeper, more complete and accurate data that you can use to optimize your website.

How can Google Analytics help you?

The world is changing— people spend more time online than ever before.

Internet users are approaching 3 billion people, with 75% of them buying products online. So if your audience is online, it only makes sense if you focus on online marketing too.

Make your website the hub of your digital marketing— all of your marketing campaigns from social media, email, referral sites, and ads should generate traffic to your website, where you can convert them into paying and loyal customers.

If you’re a marketer or business owner (no matter how small or big), then Google Analytics is the perfect tool to measure your digital marketing and online presence. The tool guides you to create a marketing strategy based on statistical numbers and data, instead of pure gut feeling and instinct.

Google Analytics tracks data about your website that can be used to create better marketing strategies, such as:

Audience Demographics

GA tracks your audience demographics, such as their gender, age, location as well as other important data about them, such as…

Their interests,

Buying preferences, and

What kind of browser they use (mobile, tablet or desktop).

When you understand your audience, you can adjust your content and funnel based on their characteristics. You can also create targeted advertising to reach a wider audience.


Traffic Source

GA lets you know where your traffic comes from, whether it’s from social media, email, referral sites, organic search, or paid ads. It also tells you which keywords bring you the most traffic.

Knowing these facts will make it easier for you to decide which channels and keywords to focus your marketing on.


Audience Engagement

GA also records your audience activities while they’re on your site. It gives you insights about…

What page(s) they visit,

How long they are on that page,

Which links they click, and

What actions they take (eg. signing up, subscribing to your newsletter, or adding a product to cart).


Website’s Performance

GA tracks the performance of every page in your site, like…

The most visited page,

The average session time of each page,

The page with the highest bounce rate,

As well as the effectiveness of your landing and conversion page.

This report enables you to identify the right content to drive conversions, as well as the weak spots on your site and how you can improve.

How Businesses use Google Analytics

Google Analytics produces real-time and tangible data to help businesses grow.

Important data such as customer behavior and demographics help companies in creating a more customer-oriented marketing campaign, that will likely increase their traffic and conversion rates and boost their online reputation management.

Sprint, one of the largest network providers in the U.S, implements Google Analytics to track their visitors' journey to understand more about them, and then created advertising campaigns based on the visitors’ interests. As a result, the Company saw a 39% boost to its conversion rate.

Not only big companies, small businesses can also
utilize GA with incredible results:

Mumzworld, an e-commerce site selling baby products, uses GA to set a custom metric for out-of-stock products, creating an efficient restocking schedule which in turn grows conversion rate by 11%.

Minted, another online marketplace, saw a significant 400% spike to their year-over-year revenue since using the tool.

Basic Steps

Here’s a step-by-step guide to set up Google Analytics for your business:

Set up your Google Analytics account

  1. 1

    Go to Google Analytics Homepage.

  2. 2

    Create a new account name.

  3. 3

    Fill in your website name and URL.

  4. 4

    Select your Industry Category.

  5. 5

    Select your Country and Time Zone.

  1. 6

    Add other users (like your marketing manager or web developer) in the ‘User Management’ section.

Implement tracking on your site

  1. 1

    After you’re done signing up, you’ll get a Global Site Tag as your tracking code. Copy and paste the code to the header of each webpage that you want to track.

  1. 2

    Wait a few minutes, then you will start seeing a live report of your website traffic in the Real-Time Reports section.

Set up your Goals

  1. 1

    Go to Admin, click the Goals button under the View setting.

  2. 2

    Click “+New Goal” to add one.

  1. 3

    Set a Goal (Built-in or Custom).

  2. 4

    Create a name for the Goal and select the Goal Type.

  3. 5

    Proceed to fill in the rest of the Goal’s details.

Set up Views with Filters

  1. 1

    Still in the same section, under the View setting.

  2. 2

    Set up multiple Views based on your Goals (you can create up to 25 views per property).

  3. 3

    Create a name for each View.

  1. 4

    Set up Filters for each View that you create.

  2. 5

    Pick a Filter (Built-in or Custom).

  3. 6

    Proceed to create a name for each Filter and set up the rest of the setting details.

Make sure to…

  1. 1

    Create multiple Views for each Property (as a minimum, create three Views: primary, testing, and backup).

  1. 2

    Exclude bots and spiders in the ‘View setting.’

  2. 3

    Filter out the internal traffic to avoid self-referral.

  3. 4

    Apply a Filter to include only appropriate hostnames.

  4. 5

    Check out the reporting time zone.

  5. 6

    Check out the reporting currency.

  6. 7

    Configure the default page.

  1. 8

    Set up appropriate data retention for the Property.

  2. 9

    Enable user-based reporting instead of session-based in ‘Property Setting.’

  3. 10

    Enable the Demographics and Interest reports.

  4. 11

    Enable the Benchmarking reports.

Additional

If you have multiple tags, you can set up Google Tag Manager. It’s compatible with other codes and tags and you can manage them all from one account.

Here’s how you set up GTM:

  1. 1

    Go to Google Tag Manager.

  2. 2

    Create an account name and select your country.

  3. 3

    Create a container name and select where to use it (website, Android, iOS or AMP).

  1. 4

    After that, you’ll get 2 codes that you need to copy and paste to the header and footer of every page on your website.

The Composition

The Tabs

Here’s the user interface you’re going to see after you set up your new Google Analytics account:

Home

Here is the overview of your GA account. If you have multiple Properties or Views, you can access all of them from here.

You’ll see basic reports about your users, sessions, bounce rate, traffic sources, and other metrics.

Customization

In this tab, you have the ability to create and track custom reports according to your needs. GA lets you create as many as you want.

Reports

You’ll get deeper insights into your reports in this tab. There are 5 reports, which are:

Real-Time

This tab provides real-time data about your current traffic, such as the number of active users, the most active pages, the top referral sites, and other important data.


Audience

This tab reports data about your visitors, such as their country, city, language, as well as the browser and operating system that they use.


Acquisition

This tab shows you the source of your site traffic, whether it’s direct, organic, referral, or from social media.


Behavior

This tab provides data about the visitors’ activities while they’re on your site. It could be the total number of page views, the title of the page viewed, the average time spent on a page, bounce rate, and the most popular search term.


Conversions

You need to set up Goals first before you start receiving reports from this tab. It shows the total number of Goals achieved in your site. A Goal could be user signing up to the newsletter, purchasing a product, or sharing content.

Admin

Here is the place to manage your Account, your Property, and your View setting.

You can create and switch to multiple accounts, websites, views, goals, and filters, among other things.

The Metrics

Metric is the qualitative measurement of your GA reports. Here are 6 important metrics you should pay attention to:

Sessions

This metric refers to the group of activities one user makes on a website during a particular time frame, which is set by default at 30 minutes by GA.

It means that if a user comes to your site, browsing for 15 minutes, leaves, and then comes back within 30 minutes, it’s recorded as one session. However, when a user is inactive for more than 30 minutes and then comes back, it’s recorded as two sessions.

Session duration

Session duration refers to the average session time spent on your site within a particular time frame. It’s measured by dividing the total number of sessions with the total time spent on your site.

If during one week there are 300 sessions with the total time spent 1.500 minutes (90.000 seconds), then the average session duration for that week is 5 minutes (300 seconds).

Users

The user metric refers to the number of visitors, new or returning, that visit your website during a particular time frame. GA relies on browser cookies to identify each new visitor as a unique individual, so if the user accesses your site three times a day, it will still be recorded as one user.

However, if that person clears his cookies or uses a different browser, GA will identify it as two different users.

Pageviews

A page view is counted each time a user views a particular page on your site. So if that user views a catalog page and then reloads it three times, GA will record it as four views of the catalog page.

If a user opens the homepage, goes to the catalog page, and then comes back to the homepage, it will be recorded as two views for the homepage and one for the catalog page.

Conversions

Conversion refers to the completion of an activity that’s important for your website. This metric is based on Goals, so make sure to set up your Goals properly.

Examples of conversion are user signing up to the newsletter, purchasing a product, or sharing an article.

Bounce rate

A bounce rate measures the number of users who visit a page in your site and then leave without browsing any further.

A high bounce rate number could be the reason for your low conversion rate– it’s a sign for you to fix your content and make a better funnel for your visitors.

Google Analytics Infographic
Embed Code:
<a href="https://milkwhale.com/resources/a-beginners-guide-to-google-analytics/" target="_blank"><img src="https://milkwhale.com/wp-content/themes/milkwhale2/landing/ga/img/infog/4-Things-You-Need-To-Know-0312.jpg" border="0" width="800" height="8370" /></a><br /><span style="font-size: 12px;">Click image to open interactive version (via <a href="https://milkwhale.com/resources/a-beginners-guide-to-google-analytics/">A BEGINNER'S GUIDE TO GOOGLE ANALYTICS</a>).</span>

Sources

Hubspot Guide | Calderaforms | Lovesdata
Google | First Site Guide | Marcel Digital